Target audience: Online conference presenters, attendees, and organizers
Online conferences, and the presentations that they are composed of, are fundamentally different than the traditional face-to-face model. However, most presenters have yet to completely adapt to this change. This brief post will point out how conference stakeholders can benefit from one feature of the Eventzil.la conference package: Session Assets.
Firstly, what are Session Assets? Session Assets are files, or information, which presenters can add to their Eventzil.la Session pages. These Assets can include, but are not limited to, embedded recordings of the presentation, PDF handouts, presentation slide files, contact information, and links to feedback forms. This allows presenters to ensure their content is available to reference, to continue the interaction with their attendees, and extend the reach of their content to a wider audience.
From the perspective of the conference attendees, it allows them to learn more from the conference. How many times have you been at an academic conference and found yourself deciding between two or more concurrent sessions? In the end, you must choose one over the other(s), and many savvy conference-goers may jot down the name of the presenters they had to miss in hopes of catching them later in the lounge or networking party. However, many of these opportunities are simply lost. However, if all presenters make full use of Eventzil.la’s Session Assets, attendees can refer back to the missed presentations, perhaps watch a shared recording of the session, download the presentation materials, and even use the contact information to follow up with the presenter. This is something that was much more difficult in the past, as very few people record video of their face-to-face conference presentations. In the current online climate, this is as simple is clicking a button to do, so there is little reason not to record your sessions. Sharing the recording as an Asset to your conference Session is just as simple.
The benefit to the conference hosts also cannot be ignored. The use of Session Assets, as explained above, simply extend the reach of all the content shared in the conference. In this way the hosting association benefits in that attendees get more value for their participation. Not only can they attend the live sessions, that were their ‘first choices’, but they can go back at their leisure to asynchronously attend their second, third, and fourth choice sessions.
Online conferences are, simply put, better than face-to-face conferences in some ways. Specifically, as this short post argues, the use of Session Assets adds increased value to all conference stakeholders. If the adaptation of Session Assets becomes normalized by presenters at online conferences, all will benefit from the increased access to quality academic content online.
How to add Assets to your conference Sessions:
First, a quick definition of terms used on Eventzil.la may be useful.
- Session: All presentations, workshops, keynotes, posters, and events scheduled on Eventzil.la are referred to as Sessions.
- Presenter: A presenter is an Eventzil.la member who is assigned to a Session.
- Assets: Files or text added to a Session. These are used to allow for the sharing of presentation materials in addition to the required Abstract that all sessions include.
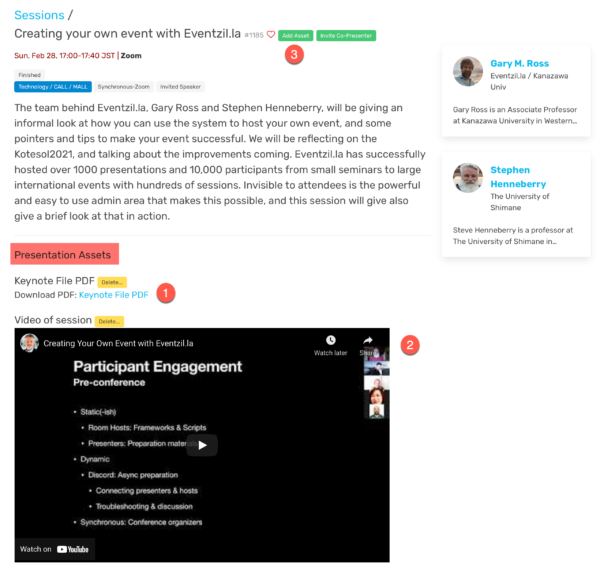
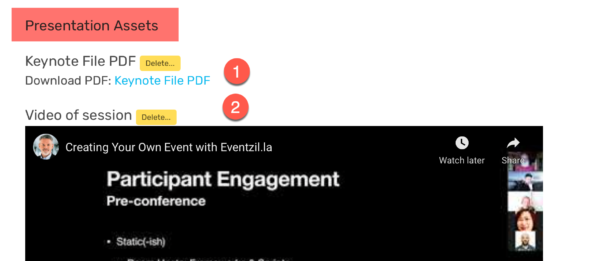
In the image above is of a Session, with two presenters, from KOTESOL 2021. In this image you can see that the session includes the time and abstract, which are included in all Sessions, and two additional Assets. The first asset (#1) is a downloadable PDF of the presentation slides, the second (#2) is an embedded video of the presentation. At the top of the image you can also see the number 3. This is the link you use to add Assets to your Session. (Of course, you can only add Assets to Sessions in which you are a Presenter.) If you click the “Add Asset” button, you will see the following screen:
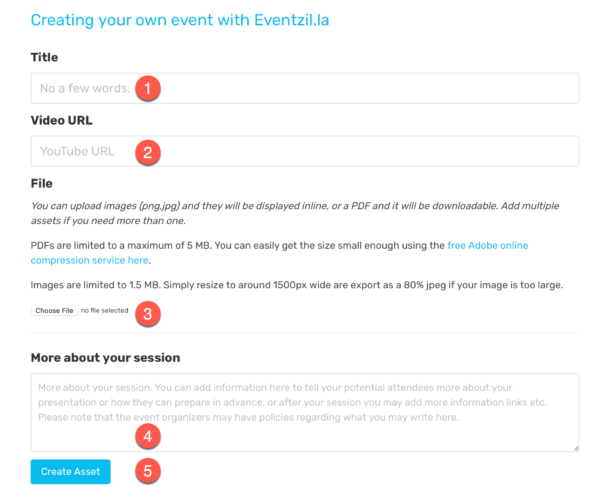
In this screen you can add a (1) title for your new Asset, (2) a URL if it is a YouTube video, (3) choose a file for upload, and (4) add more information about your session. This extra information is a good place to share replies to questions fielded during your presentation, or to provide greater context. (Currently this section is plain text only, so URLs will not be parsed to clickable links.) Finally, simply click “Create Asset” to add the Asset to your Session.